

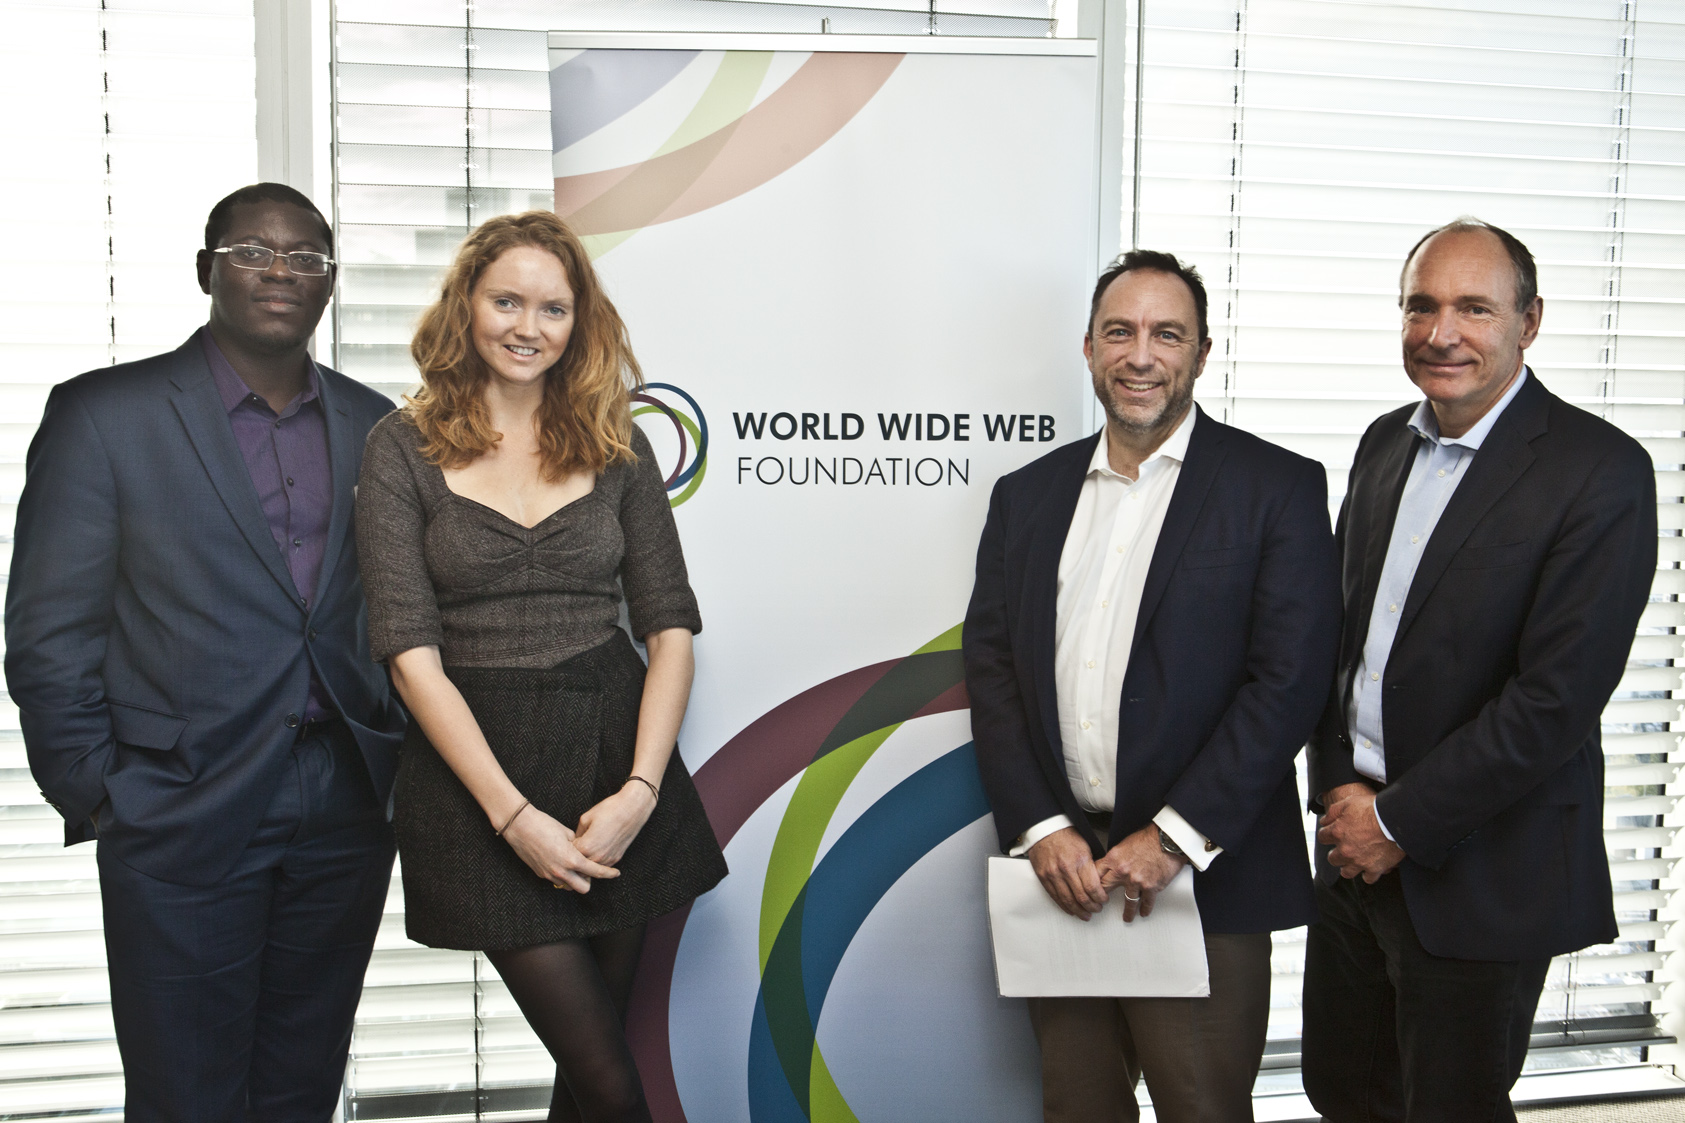
Bright Simons, Lily Cole, Jimmy Wales and Sir Tim Berners-Lee – the panel of speakers at the Web Index 2013 launch in London.
The World Wide Web Foundation has partnered with Vizualising.org to set a challenge to you to use the Web Index data and design to visualize the Web Index so that we can gain a better understanding of the impact of the World Wide Web. We are offering $4,000 in prizes and the winner will be invited to attend a World Wide Web Foundation event in 2014 to celebrate the 25th anniversary of the web.
The World Wide Web is used every day by billions of people across the globe. The more we understand about this powerful tool, the more we can help empower people with opportunities to use the Web to make decisions about their needs and developmental possibilities.
The 2013 Index contains data on 81 countries and includes indicators on gender, privacy rights, censorship, open data, and more. There are various files containing data on the Web Index website. Some sheets contain statistical facts whereas others contain expert assessment survey results. The data includes the overall rankings for all the countries (only for 2013).
Data
We’ve provided the data in XLS files and have compiled a data set for you to use in the challenge.
For the full data set and additional Web Index resources, click here.
We also encourage you to use other open data sets.
Prizes
First Prize: $3,200 and an invitation to attend a Web Foundation event in 2014 to celebrate the Web’s 25th anniversary.
Honorable Mention: $500
Student Prize: $300
Enter
Please upload your entry on Visualizing.org by clicking on ‘Enter This Challenge” to select and submit your visualisation.
Deadline: Wednesday, January 29, 2014
Scoring
Visualizations will be judged on the following criteria:
Understanding (10 Points): How effectively does the visualization communicate? How well does it help you make sense of this issue?
Originality (5 Points): Are the approach and design innovative?
Style (5 Points): Is the visualization aesthetically compelling?
More information is available on the Visualizing.org website here: http://visualising.org/contests/visualizing-impact-world-wide-web
You can register for the challenge here.